Open Access
Research Article
Max Screen >>
ISSN: 2393-9060
Copyright: © 2016 Abenet F. This is an open-access article distributed under the terms of the Creative Commons Attribution License, which permits unrestricted use, distribution, and reproduction in any medium, provided the original author and source are credited.
Related article at Pubmed, Google Scholar
A study was conducted to determine the prevalence of malnutrition and the associated risk factors in children within the age of 6-59 months. Data on dietary diversity and general health condition were gathered using semi-structured questionnaires while weight and height of children were measured using standard anthropometric procedures. Data analysis was done following standard procedures and appropriate software. Associations and correlations of the dependent and outcome variables were computed using Chi-square, OR and 95% CI. P-value less than 0.05 were considered as statistically significant. Majority of children (73%) consume a monotonous cereal based meals with 35%, 18.4% and 8.6% of children living on only one, two and three types of foods respectively. Despite the fact that the predominant means of livelihoods is pastoralism, only 3% of children consumed milk or milk products based on a 24-hour recall survey on their mothers. Our assessment indicated that significant proportion of the children were below the global reference population on most of the anthropometrics. Accordingly, we found that over 61.1% (CI=53.4%-68.8%) of them were underweight (WAZ<-2SD) and 36.5% (CI=28.9%-44.1%) were severely underweight (WAZ<-3SD). The percentage of underweight and severely underweight children was the highest in age groups 24-35 months (91.7% WAZ<-2SD). Our results also indicated that 53.2% (CI=45%-61.5%) and 33.1% (CI=25.4%-40.9%) of the children were stunted (HAZ<-2SD) and severely stunted (HAZ <-3SD) respectively. The highest percentage of stunting was in the age groups 6 to 11 months (75% HAZ<-2SD) and 24-35 months (71.4% HAZ<-2SD). The prevalence of moderate acute malnutrition (WHZ<-2SD), was 40.7% (CI=32.5%-48.9%) and severe acute malnutrition (WHZ<-3SD) was 24% (CI= 16.8%-32%). On the other hand, Z-score of Mid-upper Arm Circumference (MUAC) for age measurements showed that 76.3% (CI= 66.3%-86.3%) had MUAC<-2SD and 52.5% (CI= 40.9%-64.1%) had MUAC for age <-3SD which reconfirms the severity of acute malnutrition in the study community affected by the drought. Common childhood diseases reported by either mothers or guardians during the survey included coughing (50.6%), diarrhea (28.9%), fever (35.3%) and Oedema (9.3%). Acute malnutrition as measured by MUAC for age has been found to be significantly associated (P<0.05) with presence of fever, dietary diversity score, breast feeding and age group 6-23 months. Children aged 6-23 months of age were highly (p<0.001) associated with lesser MUAC for age measurements. A decrease in percentage of children with MUAC<11.5cm was highly associated with an increase in the dietary diversity score and the age of the child beyond two years. Our study generally indicated that malnutrition including wasting, underweight and stunting were in high prevalence and in association with a multitude of factors that are complicated by the drought in eastern Ethiopia.
Keywords: Animal source foods; Children; Drought; Dietary diversity; Malnutrition; Pastoralism
Recurrent drought has long been the major instigator for a marked social tragedy and public health problems in Ethiopia. It has been the major factor causing food insecurity and malnutrition which remained the most common causes of morbidity and mortality among children within the age of 6-59 months. According to a study conducted to estimate cost of hunger in Ethiopia, 2 out of every 5 children were found to be stunted. As many as 81% of all cases of child undernutrition and its related pathologies go untreated and 28% of all child mortality in the country has been associated with undernutrition while 16% of all repetitions in primary school has been associated with stunting (COHA, 2014). The annual costs associated with child undernutrition has been estimated at Ethiopian birr (ETB) 55.5 billion, which is equivalent to 16.5% of the country’s GDP. Eliminating stunting in Ethiopia is therefore a necessary step to achieve socioeconomic growth and transformation in the country (COHA, 2014).
There are many risk factors exposing children to malnutrition which include lack of nutritious foods to consume and various disease episodes that cause under nutrition (WHO, 2006). These also result from poor child feeding and health care practices [1]. The Ethiopian National Nutrition Strategy (NNS) document also outlines that malnutrition can be addressed through multidisciplinary and inter-sectorial efforts which also underline that the causes are also multifaceted (NNS, 2008).
As drought continues to prevail it is still undermining, among others, the food and nutrition security of vulnerable households in pastoralist areas of Ethiopia. It is frequently associated with high rates of various forms of malnutrition and high incidence of childhood diseases such. Shoertage of animal source foods (ASFs), like milk and meat and lack of vegetables, fruits and other nutritious foods is the primary factor incriminated for malnutrition, particularly wasting, stunting and micronutrient deficiency. Thus, we have conducted this study in drought affected community in the Somali region of Ethiopia to understand the prevalence and the underlying factors that predisposed children to malnutrition. The study has been commissioned by VSF Suisse, an international non-governmental organization and data was collected as part of a baseline study for a project targeting households with malnourished children for a package of livestock interventions.
To determine the prevalence of malnutrition and the associated risk factors in children less than five years of age in drought affected pastoralist communities in Siti zone, Ethiopian Somali region.
The study was conducted in Asbuli kebele of Errer Woreda, Siti zone of the Ethiopian Somali regional state located in the eastern tip of the country. According to available statistics, the Woreda is inhabited by 77,960 people, mainly the Issa clan who are predominantly Muslims. The most dominant livelihood means is livestock production managed under a subsistence production system following a classical pastoral tradition (SC-UK, HEA, 2002). Rainfall patterns are bimodal with the diraa rains expected in March to May and the karan rains in July to October. Rainfall is generally erratic and sparse with an average annual total rainfall of 500 to 700 mm. While both rainy seasons are important, failure of the diraa rains has devastating effect on livestock because it follows the long dry jilaal season. Drought spells are the main hazard affecting the zone and the area has already experienced an extended drought spell from 2011 to 2013. Before the pastoral extensive livestock production system achieve full recovery, it has been re-challenged by a very severe drought in association to the global El-Nino situation driving most of the pastoral households in to a dire humanitarian crisis that needed urgent multi-sectorial emergency response [2].
Thus, we conducted the current survey in households which were prioritized for nutrition sensitive emergency meat distribution. These beneficiaries were all Internally Displaced People (IDPs) who depend on food aid from various humanitarian organizations and the government of Ethiopia that followed the 2016 El-Nino induced drought in Eastern part of the country. The households that were included in our study represent the most vulnerable groups of the drought affected society as they were prioritized based on the level of their physical emaciation, complete loss of livelihoods, having more number of children under five years of age and mostly women headed households.
A semi-structured questionnaire survey was administered by multi-lingual enumerators trained by experienced evaluation specialists. The interview included dietary diversity score and consumption of various food groups available at households based on 24-hour recall of women and child care givers who are in charge of food preparation. We also recorded incidence of childhood diseases including the presence or absence of edema, fever, coughing and diarrhea. We also took anthropometric measurements including age, height and weight and middle-upper arm circumference (MUAC) of children in the same households where the questionnaire survey was conducted. All measurements were taken following the guidelines of WHO. We used hanging spring scales with graduations of 100g and a capacity for 26 kg for measuring the weight of the children with minimum clothing and no shoes to the nearest 0.1kg. Recumbent length measurement was taken for children under two years of age while for children above two years height was measured in a standing position in centimeters to the nearest of 0.1cm.
The project targeted households and children included in the study were prioritized for emergency food aid based on a purely humanitarian consideration. The drought emergency project has also been appraised by respective line departments in the Ethiopian Somali regional State governing NGO operations. Anthropometric measurements were taken following the informed consent of mothers and/or guardians of the children.
Data was coded and entered in to Microsoft Excel and analysis was done using Epi-Info 7 and SPSS Version 20 while the WHO Anthro Software Version 3.2.2 was used to determine the Z- score values from anthropometric data [3]. Anthropometric measurements were analyzed after adjusting for age. Accordingly, the z-scores (< -2SD) values were determined from the age, height and weight measurements giving the height for age (HAZ), weight for age (WAZ), weight for height (WHZ) and MUAC for age values using the WHO reference data base. Children were classified as stunted, underweight or wasted if HAZ, WAZ or WHZ was < -2HAZ, < -2WAZ or < -2WHZ or severe if the values are < -3Z. Dietary Diversity Scores were calculated according to the guidelines provided by the United Nations Food and Agriculture Organization, FAO, 2010 [4]. Associations and correlations of the dependent and outcome variables were computed using Chi-square, OR and 95% CI. P-values less than 0.05 were considered as statistically significant. Binary logistic regression analysis was used to identify the factors that significantly contribute to child malnutrition. We used the MUAC measurements with 11.5cm being the cutoff point for grouping the children in to two categories of malnourished (children with MUAC </=11.5cm) and not malnourished (children with MUAC >11.5cm).
The target children lived on only three food types (35%), only two food types (18.4%) and only one food type (8.6%). This indicates that about 62% of the children in the surveyed households surveyed lived on less than three types of foods and has a lower dietary diversity. Majority of children (73%) consume a monotonous cereal based meals. Forty three percent mentioned that they included either meat or meat sauce in children’s diets while none of them were consuming eggs, fruits, fish and other sea products. Despite the dominant means of livelihoods and pastoralism, only 1.73% of their children have consumed milk or milk products.
Our study indicated that the type of some food items like fish and other sea products and poultry products are entirely out of the list of foods served for children. Meat and meat were found to be the only sources for animal protein for the pastoral community. Availability and use of fruits and vegetables was also very low warranting a severe shortage of vitamins (Table 1). This coupled with the recurrence of drought which negatively affects the availability of meat and milk, have severely compromised the nutritional status of children under 5 years of age.
Figure 1 below shows the results of the individual dietary diversity score (DDS) of the children and Table 1 that follows shows the types of food groups served to children in households we surveyed.
The nutritional status of the children was assessed using key anthropometric measurements and results were interpreted according to the WHO guidelines. Accordingly, our assessment indicated a significant proportion of them were out of the global standard reference population parameters.
Weight for age (WAZ) Scores – Underweight: Our study using the anthropometric data indicated that over 61.1% of children were severely underweight (<-2SD) while over 36.5% were severely underweight <-3SD. The percentage of underweight and severely underweight children was the highest in age groups 24-35 months (Table 2).
Height for age – Stunting: The z-score of the height-for-age ratio, (HAZ score) is a measure of stunting in children. Results from the current survey indicated that 53.2% and 33.1% of children were stunted (HAZ<-2SD) and severely stunted (HAZ <-3SD) respectively. The highest percentage of stunting was in the age group of 6 to 11 months. Table 3 and Figure 4 below presents our findings.
Weight for Height (WHZ Score): The weight-for-height z-score, otherwise can be referred as prevalence of acute malnutrition, of children in the present study was 40.7% of moderate acute malnutrition (MAM, WHZ<-2SD) and 24% of severe acute malnutrition (SAM, WHZ<-3SD). Figure 5 below shows the WHZ score of 134 children compared with the WHO reference curve. Table 4 presents the prevalence of both moderate and severe acute malnutrition in different age categories with 95% Confidence Intervals.
Mid-upper arm circumference MUAC for Age: Mid-upper arm circumference is another indicator for acute malnutrition in children under 5 years of age. The Z-score of MUAC measurements in the study children showed that 76.3% had MUAC<-2SD and 52.5% had MUAC<-3SD which reconfirms the severity of acute malnutrition in the study community. The lowest MUAC score was observed in the age group 24-35 months (Table 5). Figure 6 also gives the percentage of the children with MUAC ranging from 8 to 15 cm and indicates that over 30% of the children studies had MUAC less than 11.5cm which is the cutoff point recommended by WHO for public health emergency intervention.
Common childhood diseases encountered in our survey included coughing (50.6%), diarrhea (28.9%), fever (35.3%) and Oedema (9.3%) (Table 6).
We first conducted a one to one Chi-square analysis to understand the association of each explanatory variable in our study with the outcome variable which is status of a child being classified as malnourished or not based on dichotomy of MUAC measurements using 11.5cm as our cut off point. From this, it was clearly evident that wasting (MUAC<11.5cm) significantly associated with presence of fever, dietary diversity score, breast feeding and age group 6-23 months. Presence or absence of diarrhea had a marginal significance (P=0.07). Children aged 6-23 months of age were highly (p<0.001) associated with lesser MUAC measurements. A decrease in percentage of children with MUAC<11.5cm was highly associated with an increase in the dietary diversity score and the age of the child beyond two years. The chi-square and P values for all the factors we have considered are presented in Table 7 below.
Following the results above (Table 7), we also conducted multiple logistic regression analysis using a backward stepwise approach, in which all factors tending to contribute to malnutrition based on their chi-square values and biological considerations were entered in to the model. Measurements of MUAC were dichotomized and entered as outcome variables using 11.5cm as a standard cut off point to nominate children as malnourished and not malnourished. The explanatory variables entered in to the regression model were presence or absence of diarrhea, coughing, fever and edema, whether the child is breastfed or not, vaccinated or not, dietary diversity score, sex and age group.
Accordingly, variables including vaccination, sex, coughing and edema were eliminated in the first step indicating that they have the least contribution to MUAC values of children under the current study. Presence or absence of fever, Dietary diversity score and diarrhea were eliminated in steps two, three and four with no significant changed in the model respectively. Finally, we found that only whether a child is breast fed or not was the sole factor significantly contributing for child malnutrition. Children which were breast fed during the study period had 5 times better chance of having their MUAC values well over 11.5cm (P<0.05) (Table 8).
We also saw that our model, have explained 89% of the variation in our outcome variable based Nagelkerke R2 value. Evaluation of the predictive power of our model shows that both the positive and negative predictive values are above 93% until the last step. This indicates that breast feeding is the most important factors contributing to the sensitivity and specificity of the model because the overall percentage predictive power of the model has not significantly changed while all the other variables except breast feeding were removed out step by step (Table 9).
The study was conducted, as part of an operational research in an area affected by a severe drought in the Horn of Africa. The study subjects were also drawn from a nutrition-based livestock emergency intervention. According to a household dietary diversity score, children studied have lived on only three food types (35%), only two food types (18.4%) and only one food type (8.6%). This indicated that about 62% of the children in the surveyed households lived on less than three types of foods and had a lower dietary diversity score. Majority of children (73%) consumed a monotonous cereal based meals. Forty three percent mentioned that they included either meat or meat sauce in children’s diets while none of them were consuming eggs, fruits, fish and other sea products. Despite the dominant means of livelihoods is pastoralism, only 3% of children had consumed milk or milk products on a day before the survey. Lower dietary diversity score has been significantly associated (P<0.05) with higher incidence of malnutrition (Table 7). Other similar studies on dietary diversity have indicated that lower dietary diversity score is highly associated with child malnutrition [1,5]. Dairy products, fish and sea products, eggs and fruits were generally absent in the diets of the study children indicating very low consumption of animal source foods. The low nutrient density including protein and fat and bioavailability of various nutrients such as vitamin A, iron, Ca and Zinc presents obvious problems associated with typical cereal-based porridges. Ayele and Peacock (2003) have also indicated a significant improvement in the nutritional status of children participating in dairy goat project [6]. Kim, et al. (2009) have also emphasized the special beneficial qualities of animal-source foods, which contain high levels of minerals important for growth, high-quality protein, and no antinutrients or fibers [7]. In order to improve the dietary diversity of children, the intake of meat (both lean meat and organ meat) should be promoted as it is an excellent source of high-quality protein and several important micronutrients and has a particular positive effect on iron status. But meat is relatively expensive and, in many settings like in the case of drought situation, it is not easily available, and it has to be prepared in special ways to be acceptable to young children. On the other hand the complete absence of very important food items like eggs and fish warrants a cost effective means of improving household dietary diversity and thus reducing malnutrition in children. Eggs have a very high nutritional value, as they provide all the nutrients necessary for a bird embryo to develop. Eggs, which contain high amounts of high-quality protein and fat, preformed vitamin A, and other important micronutrients are often more easily available at the community level than milk and meat, have a lower cost, and can be bought in small quantities and researchers advise that they should be given to moderately malnourished children [7]. Lack of dietary diversity is particularly a considerable problem among poor populations of developing world as their diets are predominantly based on starchy staples. In the present study, cereal consumption was predominant and almost all other food group consumption was generally very low. Especially, animal food consumption was higly compromised, most evidently due to the prevailing drought. Increasing dietary diversity among other interventions on health and child feeding practices could, therefore, improve malnutrition as it does in other parts of the world [8].
The present study also indicated that the prevalence of both chronic and acute malnutrition have been generally very high in the project targeted areas. Accordingly, over 61.1% of the children were underweight (WAZ<-2SD) while over 36.5% were severely underweight WAZ<-3SD. Mid-upper arm circumference is another indicator for acute malnutrition in children under 5 years of age. Lower MUAC measurements are associated with acute food deprivation. The Z-score of MUAC measurements in the present study showed that 76.3% of children had MUAC <-2SD and 52.5% had MUAC <-3SD which reconfirms the severity of acute malnutrition in the study community. The lowest MUAC score was observed in the age group 24-35 months (Table 5). Thirty percent of the children studied had MUAC less than 11.5cm which is the cutoff point recommended by WHO for public health emergency interventions. Mason, et al. (2012) and Singh, et al. (2006) have similarly reported high malnutrition rates in children in households affected by drought and conflicts [9-11]. Solomon and Amare (2013) have reported 42.3% of wasting, 34.4% of stunting and 47.7% of underweight in Dolo Ado district of Somali region South of Ethiopia while Yalew (2014) has indicated stunting, wasting and underweight in the order of 44%, 29% and 10% respectively in Lalibela, Amhara regional state, Northern Ethiopia [12,13]. The chronic malnutrition rates in our study are quit in agreement with a number of other studies while the findings on the acute malnutrition rates are higher than previous reports [9,10,12-15]. This can be associated to the fact that our study community were under a continued food and nutrition security problem where two consecutive rains failed [16]. We also took the data from the high risk group of children striving in the middle of a severe drought and from internally displaced people - households that were prioritized for emergency humanitarian support.
We have found that 38.8% of children had MUAC <11.5cm had diarrhea compared to 63.2% which did not have diarrhea (P=0.07). Wasting in children is a symptom for acute undernutrition, usually as a consequence of insufficient food intake or a high incidence of infectious diseases, especially diarrhea. On the other hand, wasting, expressed in either MUAC<11.5cm and/or Weight-for-height z-score WHZ<-2SD) in turn impairs the functioning of the immune system and can lead to increased severity and duration of and susceptibility to infectious diseases and thus an increased risk for death. Our study also indicated that history of having fever has been highly associated with wasting (Chi-square values of 7.2; P<0.01) (Table 7). Common childhood diseases encountered in our survey included coughing (50.6%), diarrhea (28.9%), fever (35.3%) and Oedema (9.3%) (Table 6). However these illnesses showed negative relations with MUAC, they did not have statistically significant association with malnutrition except fever which showed highly significant association (Chi-square =7.2; P<0.01). Acute watery diarrhea, as opposed to persistent diarrhea, can be fatal and may not allow time for children to be found malnourished and it is often less associated with malnutrition [17].
On the other end, malnutrition will not only increase the risk of contracting infectious diseases, but also increases disease severity and therefore the risk of death to the children. Along with poor prior health and immunization status, decreased access to basic needs such as food, water, shelter, and sanitation, we found the study community under high risk of contracting various infectious diseases and subsequent death. Furthermore, infectious diseases can also exacerbate malnutrition [18]. This destructive needs to be broken with appropriate food and nutritional support for the drought affected households, treatment of malnourished children as well as preventing and rapidly treating disease conditions.
Diarrhea and pneumonia associated with malnutrition are probably the commonest causes of death in young children worldwide [19,20]. Especially persistent diarrhea often causes deterioration of nutritional status, and poor nutritional status has been shown to increase the duration of diarrheal illness. Effects of nutritional status on incidence of diarrheal episodes, which is more determined by environment and personal hygiene, are more varied; the same applies to severity. In general, rehydration is of priority for management of acute diarrhea, with nutrition becoming increasingly important as the duration increases towards persistent diarrhea. The causal relationship between diarrheal infection and malnutrition is believed to be multifactorial - persistent mucosal injury due to specific pathogens like E. coli, Shigella, Salmonella, Campylobacter, sequential infections with multiple pathogens, and host factors including macro, micronutrient deficiency and compromised immune system will interact to determine the causal relations [16,17,19].
Our study indicated that wasting, underweight and stunting are associated with a multitude of factors that are complicated by the socioeconomic impact of drought in the Horn of Africa in general and eastern Ethiopia in particular. More number of predisposing factors to malnutrition than we have considered in the present survey seem to be interacting to determine the nutritional status of the children especially stunting. Of these possible factors household income, education level and age of mothers, conditions of hygiene and sanitation, optimal infant feeding practices and status of malnutrition in mothers are some of the factors. Clarifying these relations will have tremendous implication in terms of planning and implementing emergency nutrition and nutrition-sensitive livelihood projects in the pastoralist areas of Ethiopia.
Since the present assessment was conducted in households amidst severe drought, dietary diversity was severely compromised and children lived on less than three types of food items and were deprived of animal source foods.
Our results hence indicated that there were very high rates of both chronic and acute malnutrition along with various infectious diseases complicating the emergency response to drought affected people and warranting intersectoral partnership among humanitarian bodies.
There is a considerable gap in early detection, warning and action on drought and its consequences which has made the cost of emergency drought response very high by driving a large proportion of people in to socioeconomic crisis. Thus, it is high time that government, donor organizations and humanitarian actors join their efforts towards devising a mechanism of early detection, early warning and real-time emergency response;
Efforts have to be directed towards building resilience and capacity of the community to cope with the underlying factors of malnutrition alongside the humanitarian efforts to save lives. Treating malnutrition will never suffice to address the problems sustainably. It requires working on the root causes of the problem which can generally be associated with the quality and quantity of food and the health services available with special emphasis on animal source foods availability and accessibility;
Under conditions of recurrent drought where pastoralist households are in a difficult situation to produce or otherwise have economic access to nutrient dense animal source foods, there should be an agreed standard and operational guidelines how they should be supported with rationing of animal source foods which are the most deficient from their regular diets;

![]()

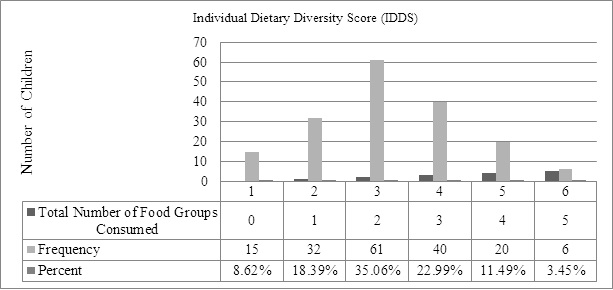 |
Figure 1: Individual Dietary Diversity Score (n=174) |
Food Groups/Types |
Response |
Frequency |
Percent |
95% LCL |
95% UCL |
Cereals |
Yes |
127 |
72.99% |
65.75% |
79.43% |
No |
47 |
27.01% |
20.57% |
34.25% |
|
Eggs |
Yes |
0 |
0 |
0 |
0 |
No |
174 |
100.00% |
97.90% |
100.00% |
|
Fish and Sea Foods |
Yes |
0 |
0 |
0 |
0 |
No |
174 |
100.00% |
97.90% |
100.00% |
|
Fruits |
Yes |
1 |
0.57% |
0.01% |
3.16% |
No |
173 |
99.43% |
96.84% |
99.99% |
|
Legumes and Nuts |
Yes |
12 |
6.94% |
3.64% |
11.80% |
No |
161 |
93.06% |
88.20% |
96.36% |
|
Meat |
Yes |
75 |
43.10% |
35.63% |
50.81% |
No |
99 |
56.90% |
49.19% |
64.37% |
|
Milk and Milk Products |
Yes |
3 |
1.73% |
0.36% |
4.98% |
No |
170 |
98.27% |
95.02% |
99.64% |
|
Oils and Fats |
Yes |
35 |
20.35% |
14.60% |
27.15% |
No |
137 |
79.65% |
72.85% |
85.40% |
|
Spices and Beverages |
Yes |
0 |
0 |
0 |
0 |
No |
174 |
100.00% |
97.90% |
100.00% |
|
Sweets (Tea with Sugar) |
Yes |
98 |
56.32% |
48.61% |
63.81% |
No |
76 |
43.68% |
36.19% |
51.39% |
|
Vegetables |
Yes |
33 |
18.97% |
13.43% |
25.59% |
No |
141 |
81.03% |
74.41% |
86.57% |
|
Table 1: Frequency of food groups consumed by children less than 5 years based on 24-hour consumption recall (April, 2016) |
|||||
Age in N months |
Weight-for-age (%) |
||||
% < -3SD |
(95% CI) |
% < -2SD |
(95% CI) |
||
(6-11) |
22 |
36.4 |
(14%, 58.7%) |
54.5 |
(31.5%, 77.6%) |
(12-23) |
43 |
30.2 |
(15.3%, 45.1%) |
48.8 |
(32.7%, 64.9%) |
(24-35) |
24 |
54.2 |
(32.1%, 76.2%) |
91.7 |
(78.5%, 100%) |
(36-47) |
41 |
39 |
(22.9%, 55.2%) |
56.1 |
(39.7%, 72.5%) |
(48-60) |
36 |
27.8 |
(11.8%, 43.8%) |
63.9 |
(46.8%, 81%) |
Overall |
167 |
36.5 |
(28.9%, 44.1%) |
61.1 |
(53.4%, 68.8%) |
Table 2: Prevalence of underweight as measured by weight-for-age z-scores in children less than five years |
|||||
Age in N months |
Length/height-for-age (%) |
||||
% < -3SD |
(95% CI) |
% < -2SD |
(95% CI) |
||
(6-11) |
20 |
60 |
(36%, 84%) |
75 |
(53.5%, 96.5%) |
(12-23) |
42 |
35.7 |
(20%, 51.4%) |
54.8 |
(38.5%, 71%) |
(24-35) |
21 |
38.1 |
(14.9%, 61.2%) |
71.4 |
(49.7%, 93.1%) |
(36-47) |
36 |
25 |
(9.5%, 40.5%) |
38.9 |
(21.6%, 56.2%) |
(48-60) |
34 |
20.6 |
(5.5%, 35.7%) |
41.2 |
(23.2%, 59.2%) |
Overall |
154 |
33.1 |
(25.4%, 40.9%) |
53.2 |
(45%, 61.5%) |
Table 3: Prevalence of Stunting as measured by height-for-age z-scores in children less than five years |
|||||
Age in N months |
Weight-for-length/height (%) |
||||||||||
% < -3SD |
(95% CI) |
% < -2SD |
(95% CI) |
% > +1SD |
(95% CI) |
% > +2SD |
(95% CI) |
% > +3SD |
(95% CI) |
||
(6-11) |
19 |
26.3 |
(3.9%, 48.7%) |
47.4 |
(22.3%, 72.5%) |
26.3 |
(3.9%, 48.7%) |
10.5 |
(0%, 27%) |
10.5 |
(0%, 27%) |
(12-23) |
41 |
19.5 |
(6.2%, 32.9%) |
31.7 |
(16.2%, 47.2%) |
17.1 |
(4.3%, 29.8%) |
4.9 |
(0%, 12.7%) |
2.4 |
(0%, 8.4%) |
(24-35) |
22 |
36.4 |
(14%, 58.7%) |
45.5 |
(22.4%, 68.5%) |
0 |
(0%, 2.3%) |
0 |
(0%, 2.3%) |
0 |
(0%, 2.3%) |
(36-47) |
35 |
11.4 |
(0%, 23.4%) |
34.3 |
(17.1%, 51.4%) |
2.9 |
(0%, 9.8%) |
0 |
(0%, 1.4%) |
0 |
(0%, 1.4%) |
(48-60) |
32 |
34.4 |
(16.4%, 52.4%) |
50 |
(31.1%, 68.9%) |
0 |
(0%, 1.6%) |
0 |
(0%, 1.6%) |
0 |
(0%, 1.6%) |
Total: |
150 |
24 |
(16.8%, 31.2%) |
40.7 |
(32.5%, 48.9%) |
8.7 |
(3.8%, 13.5%) |
2.7 |
(0%, 5.6%) |
2 |
(0%, 4.6%) |
| Table 4: Weight-for-height (WHZ) z-scores indicating the prevalence of wasting in children less than 5 years of age | |||||||||||
Age in N groups |
Mid-upper arm circumference-for-age** (%) |
||||||||||
% < -3SD |
(95% CI) |
% < -2SD |
(95% CI) |
% > +1SD |
(95% CI) |
% > +2SD |
(95% CI) |
% > +3SD |
(95% CI) |
||
(6-11) |
13 |
30.8 |
(1.8%, 59.7%) |
46.2 |
(15.2%, 77.1%) |
0 |
(0%, 3.8%) |
0 |
(0%, 3.8%) |
0 |
(0%, 3.8%) |
(12-23) |
19 |
47.4 |
(22.3%, 72.5%) |
84.2 |
(65.2%, 100%) |
0 |
(0%, 2.6%) |
0 |
(0%, 2.6%) |
0 |
(0%, 2.6%) |
(24-35) |
10 |
80 |
(50.2%, 100%) |
80 |
(50.2%, 100%) |
0 |
(0%, 5%) |
0 |
(0%, 5%) |
0 |
(0%, 5%) |
(36-47) |
20 |
65 |
(41.6%, 88.4%) |
80 |
(60%, 100%) |
0 |
(0%, 2.5%) |
0 |
(0%, 2.5%) |
0 |
(0%, 2.5%) |
(48-60) |
18 |
44.4 |
(18.7%, 70.2%) |
83.3 |
(63.3%, 100%) |
0 |
(0%, 2.8%) |
0 |
(0%, 2.8%) |
0 |
(0%, 2.8%) |
Total: |
80 |
52.5 |
(40.9%, 64.1%) |
76.3 |
(66.3%,86.2%) |
0 |
(0%, 0.6%) |
0 |
(0%, 0.6%) |
0 |
(0%, 0.6%) |
| Table 5: Mid-upper arm circumferences (MUAC) of children amidst of a severe drought crisis in Siti zone of Somali Regional State of Ethiopia, April 2016 | |||||||||||
Indicators |
Frequency |
Percent |
95% LCL |
95% UCL |
|
Coughing |
Yes |
87 |
50.58% |
42.87% |
58.28% |
No |
85 |
49.42% |
41.72% |
57.13% |
|
Diarrhea |
Yes |
50 |
28.90% |
22.27% |
36.27% |
No |
123 |
71.10% |
63.73% |
77.73% |
|
Fever |
Yes |
61 |
35.26% |
28.16% |
42.87% |
No |
112 |
64.74% |
57.13% |
71.84% |
|
Oedema |
Yes |
16 |
9.25% |
5.38% |
14.58% |
No |
157 |
90.75% |
85.42% |
94.62% |
|
| Table 6: Frequency of common childhood disease indicators (n =174) | |||||
Determinant factor |
Children with MUAC=11.5cm (No, %) |
Children with MUAC>11.5cm (No, %) |
Chi-square |
P-value |
|
Had Diarrhea |
Yes |
21 (36.8%) |
29 (25%) |
2.6 |
0.07 |
No |
36 (63.2%) |
87 (75%) |
|||
Had Coughing |
Yes |
27 (47.4%) |
57 (49.1%) |
0.19 |
0.39 |
No |
30 (52.6%) |
59 (50.9%) |
|||
Had Oedema |
Yes |
5 (8.8%) |
11 (9.5%) |
0.2 |
0.56 |
No |
52 (91.2%) |
105 (90.5%) |
|||
Had Fever |
Yes |
28 (49.1%) |
33 (28.4%) |
7.2 |
0.006 |
No |
29 (50.9%) |
83 (71.6%) |
|||
Vaccination |
Yes |
20 (35.1%) |
29 (25.0%) |
1.9 |
0.12 |
No |
37 (64.9%) |
87 (75.0%) |
|||
Dietary Diversity Score |
1 |
16 (28.1%) |
30 (25.9%) |
9.3 |
0.03 |
2 |
24 (42.1%) |
38 (32.8%) |
|||
3 |
15 (26.3%) |
24 (20.7%) |
|||
4 |
2 (3.5%) |
18 (15.5%) |
|||
5 |
0 (0%) |
6 (5.2%) |
|||
Sex |
Male |
28 (49.1%) |
59 (50.9%) |
0.05 |
0.48 |
Female |
29 (50.9%) |
57 (49.1%) |
|||
Breast Feeding |
Yes |
28 (49.1%) |
40 (34.5%) |
4.1 |
0.043 |
No |
29 (50.9%) |
76 (65.5%) |
|||
Age Groups in months |
6-11 |
24 (42.1%) |
0 (0%) |
132.3 |
0.000 |
12-23 |
32 (56.1%) |
12 (10.3%) |
|||
24-35 |
0 (0%) |
25 (21.6%) |
|||
36-47 |
0 (0%) |
37 (31.9%) |
|||
48-60 |
0 (0%) |
42 (24.3%) |
|||
| Table 7: Risk Factors associated with wasting based on MUAC measurements (6-60 months of age) | |||||
B |
S.E. |
Wald |
df |
Sig. |
Exp(B) |
95% C.I. for Exp(B) |
|||
Lower |
Upper |
||||||||
Step 4a |
Breast-fed |
1.609 |
.760 |
4.483 |
1 |
0.03 |
5.0 |
1.127 |
22.181 |
Table 8: Stepwise Elimination of the Variables Considered in the Model |
|||||||||
Observed |
Predicted |
||||
MUAC |
Percentage Correct |
||||
≤11.5cm |
>11.5cm |
||||
Step 4 |
MUAC |
≤11.5cm |
57 |
0 |
100.0 |
12 |
104 |
89.7 |
|||
Overall Percentage |
93.1 |
||||
Table 9: Predictive Power of the Current Model to Classify Children as Malnourished and Not Malnourished Based on 11.5cm as cut off Value |
|||||


